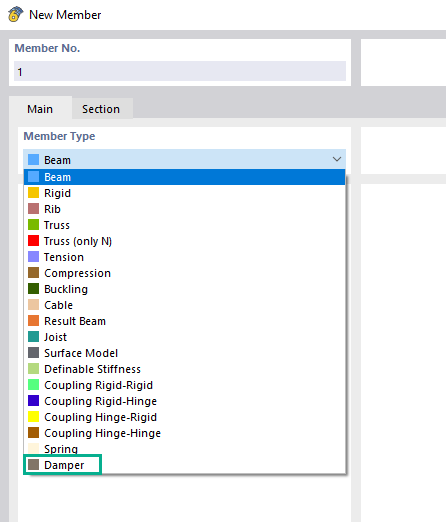
Using the "Damper" member type, you can define a damping coefficient, a spring constant, and a mass. This member type extends the possibilities within the Time History Analysis.
With regard to viscoelasticity, the "Damper" member type is similar to the Kelvin-Voigt model, which consists of the damping element and an elastic spring (both connected in parallel).
The building model is calculated in two phases:
- Global 3D calculation of the global model, where the slabs are modeled as a rigid plane (diaphragm) or as a bending plate
- Local 2D calculation of the individual floors
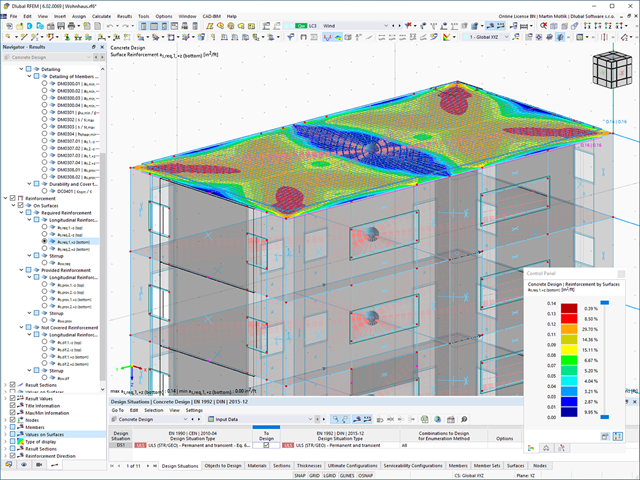
After the calculation, the results of the columns and walls from the 3D calculation and the results of the slabs from the 2D calculation are combined in a single model. This means that there is no need to switch between the 3D model and the individual 2D models of the slabs. The user only works with one model, saves valuable time, and avoids possible errors in the manual data exchange between the 3D model and the individual 2D ceiling models.
The vertical surfaces in the model can be divided into shear walls and opening lintels. The program automatically generates internal result members from these wall objects, so they can be designed as members according to any standard in the Concrete Design add-on.
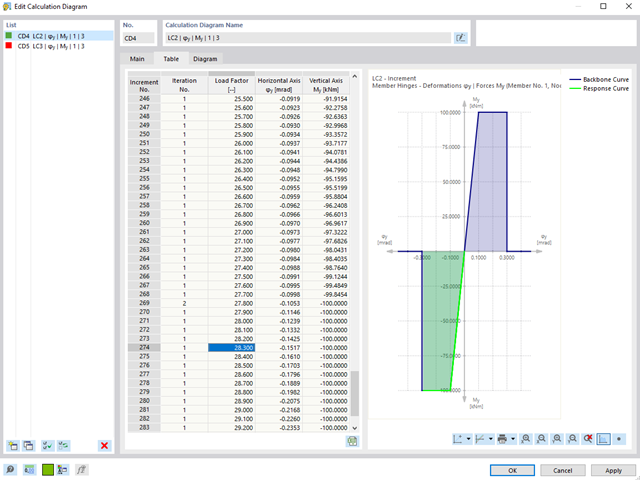
For calculation diagrams, the "2D | Hinge" is available. These hinge diagrams show the hinge response of load situations for nonlinear hinges.
For calculations with several load situations, such as is the case with pushover analyzes and time history analysis, you can evaluate the state of the hinge in each load step.
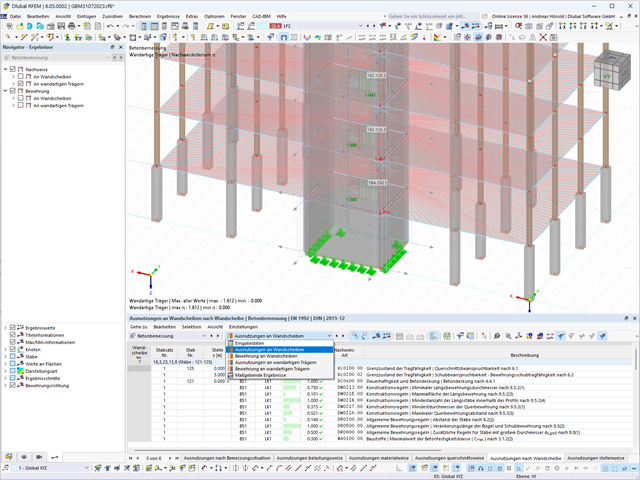
Shear walls and deep beams of a building model are available as independent objects in the design add-ons. This allows for faster filtering of the objects in results, as well as better documentation in the printout report.
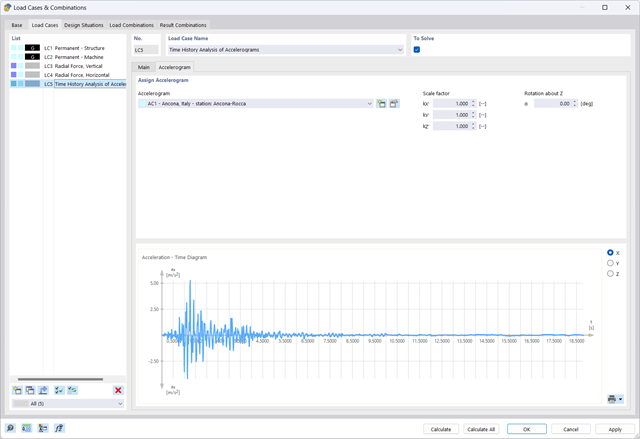
The Time History Analysis add-on provides you with accelerograms for the calculation. This extension allows for dynamic structural analysis of the acceleration-time diagrams.
There is an extensive library of earthquake records available for you, but you can also enter or import your own diagrams. The time history analysis is performed using the modal analysis or the linear implicit Newmark analysis.
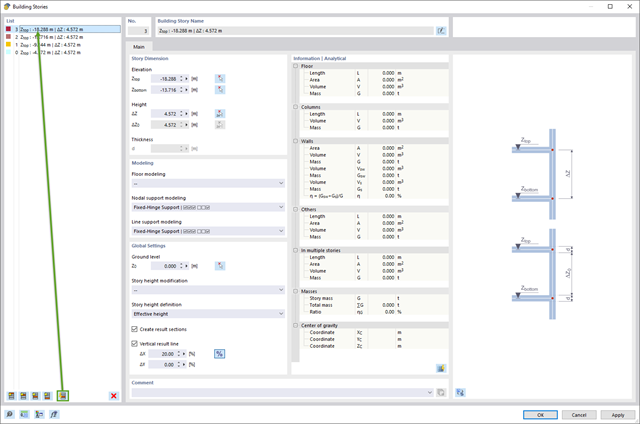
The building story generator in the Building Model add-on allows you to automatically create building stories, depending on the topology of the model.
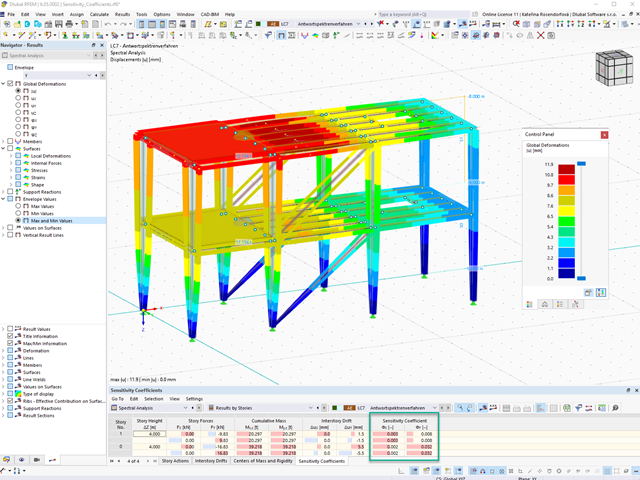
For a response spectrum analysis of building models, you can display the sensitivity coefficients for the horizontal directions by story.
These key figures allow you to interpret the sensitivity to stability effects.
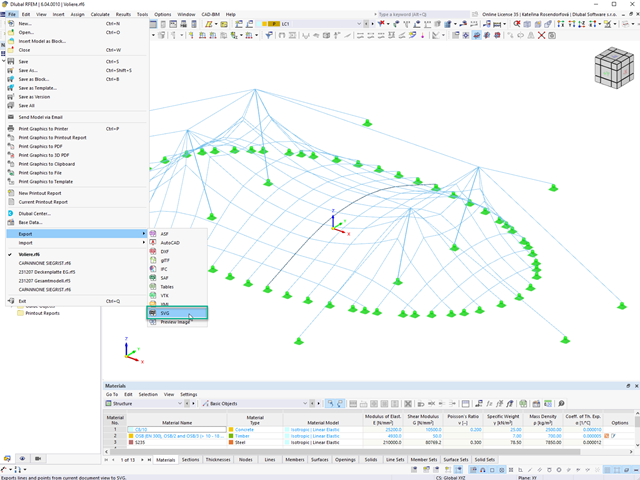
In RFEM 6 and RSTAB 9, you can export line graphics to the SVG format (vector graphics).
SVG stands for Scalable Vector Graphics and is an XML-based file format for displaying two-dimensional vector graphics. These vector graphics can be scaled without loss. It is possible to edit the SVG files using text editors, embed them on websites, and open them in the usual browsers.
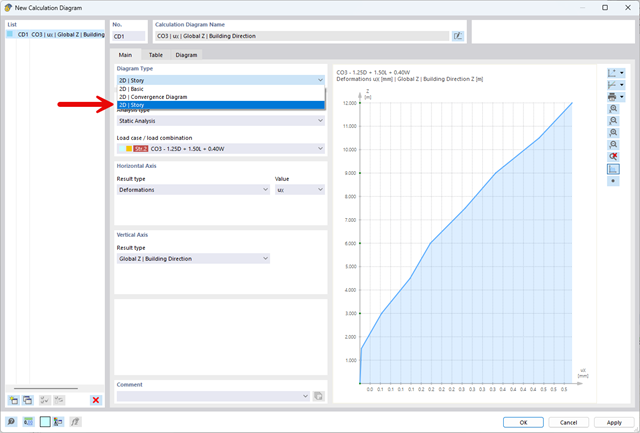
The "2D | Story" calculation diagram type is used to create result diagrams via the building axis. This allows you to easily analyze the behavior of the entire building under static and dynamic effects.
You can use this diagram type, for example, to visualize the seismic force over the building height.
- Analysis of time diagrams and accelerograms (acceleration-time diagrams exciting the supports of a structure)
- Combination of user-defined time diagrams with nodal, member, and surface loads, as well as free and generated loads
- Combination of several independent excitation functions
- Linear implicit Newmark analysis or modal analysis in time history
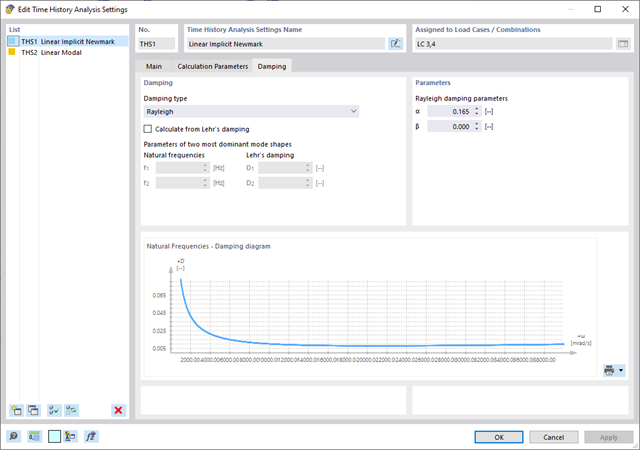
- Structural damping using Raleigh damping coefficients or Lehr's damping value
- Graphical display of results in calculation diagrams
- Result display in individual time steps or as an envelope during the entire time period
- Extensive library of seismic events (accelerograms)
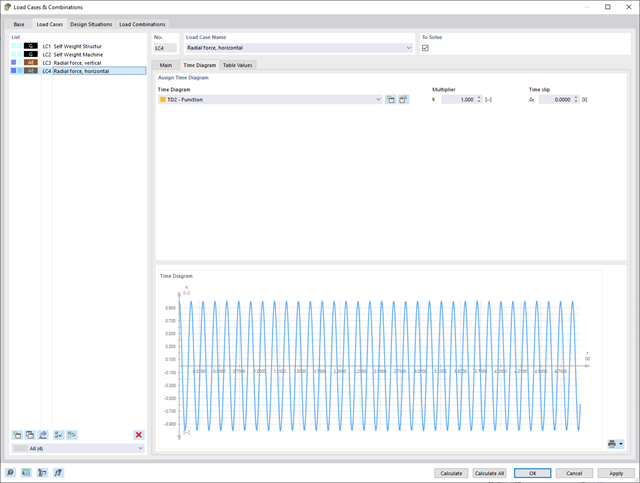
It is necessary to enter the required force-time diagrams. They can be combined in load cases or load combinations of the type Time History Analysis | Time Diagrams with the loading in order to define where and in which direction the force-time diagrams act.
The second option is to enter acceleration-time diagrams, which can be used in the load cases of the Time History Analysis | Accelerogram type.
All calculation parameters are specified in the time history analysis settings. These include, for example, the type of analysis method and the maximum calculation time.
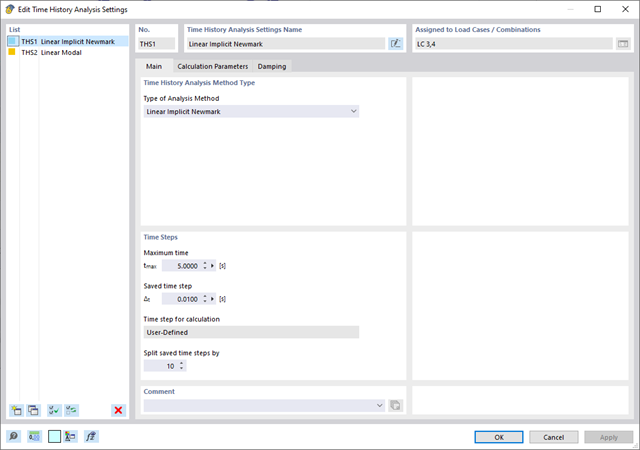
The time history analysis is performed with the modal analysis or the linear implicit Newmark analysis. The time history analysis in this add-on is limited to linear structural systems. Although the modal analysis represents a fast algorithm, it is necessary to use a certain number of eigenvalues to ensure the required accuracy of results.
The implicit Newmark analysis is a very precise method, independent of the number of eigenvalues used, but requires sufficient small time steps for the calculation.
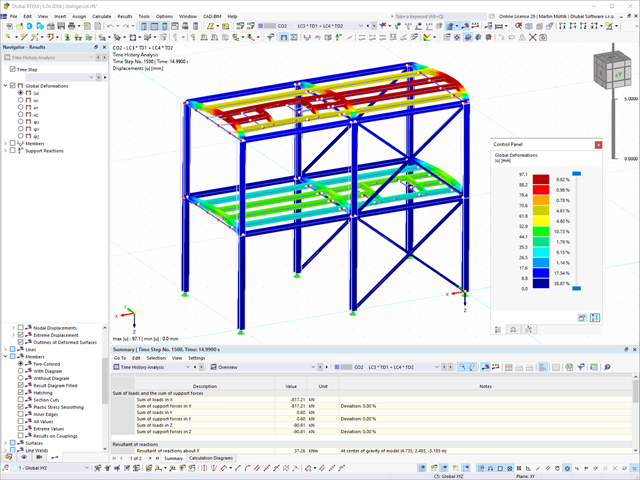
As soon as the program has completed the calculation, the summary of the results is listed. All result windows are integrated in the main program RFEM/RSTAB. You will find all the results arranged in tables; they can be displayed for each individual time step or as an envelope, and you also have the option of displaying the results graphically as well as animating them.
The results from the time history analysis can be displayed in the calculation diagrams. All the results are shown as a function of time. You can export the numeric values to MS Excel.
All result tables and graphics are part of the RFEM/RSTAB printout report. In this way, you can ensure clearly arranged documentation. You can also export the tables to MS Excel.
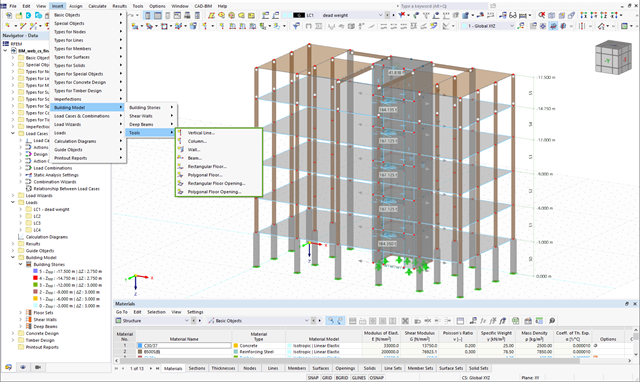
Several modeling tools are available for elements in building models:
- Vertical line
- Column
- Wall
- Beam
- Rectangular floor
- Polygonal floor
- Rectangular floor opening
- Polygonal floor opening
This feature allows you to define the element on the ground plane (for example, with a background layer) with the associated multiple element creation in space.
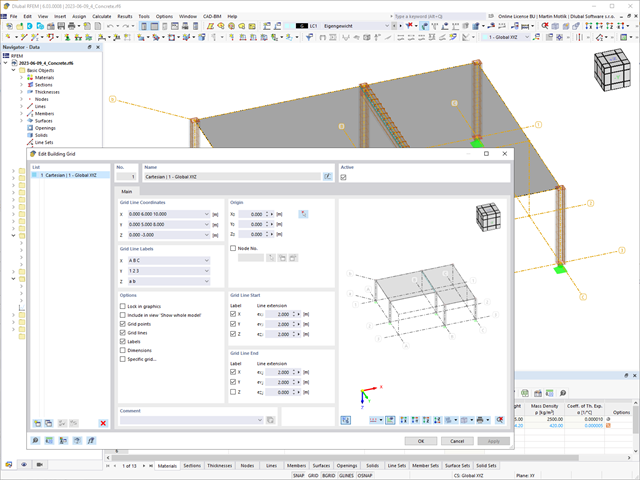
The "Building Grid" guide object supports you in the design of your structure. It features intuitive grid coordinate input and grid line labeling.
You can quickly place grids in space and label them by specifying a graded coordinate code. The grid line end modification allows you to optimize the grid appearance. Furthermore, a preview helps you to define the building grid.
Go to Explanatory Video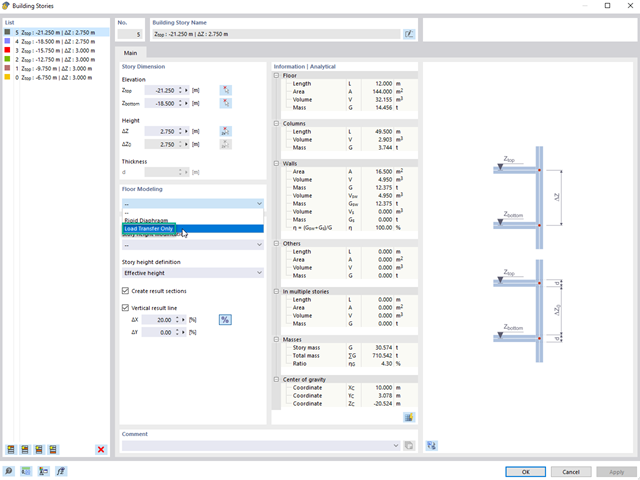
Using the "Load Transfer Only" story type, you can consider slabs without stiffness effect in and out of the plane in the Building Model add-on. This element type collects the loads on the slab and transfers them to the supporting elements of a 3D model. Thus, you can simulate secondary components, such as grillage and similar load distribution elements, without any further effect in the 3D model.
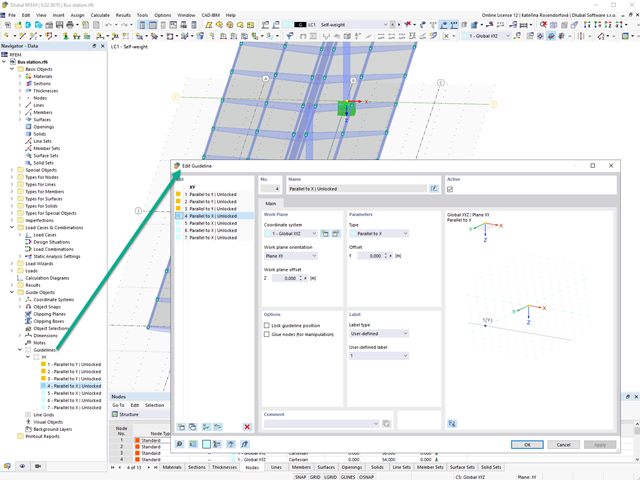
Create guidelines with or without a description for the display of a building grid! You can lock the guideline position to prevent accidental movement of them, for example.
Furthermore, you can glue the guidelines to nodes in order to move the glued nodes as well. That makes your work a lot easier!
Go to Explanatory Video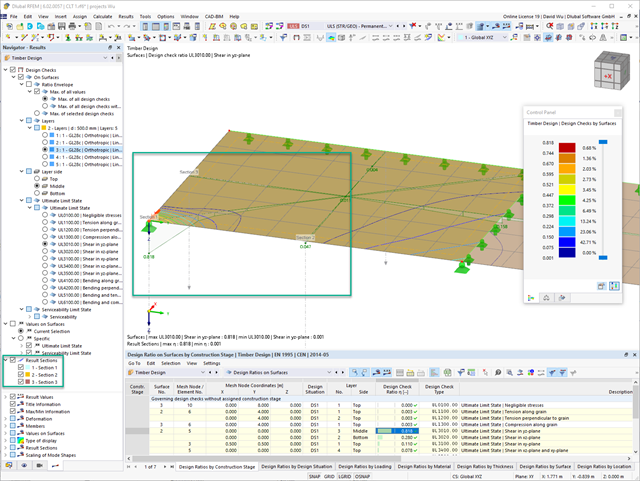
You can graphically evaluate result sections for the timber surface design. This can be done in the RFEM graphic as well as in the result history window. The sections can be placed at any location in order to evaluate the design results in detail.
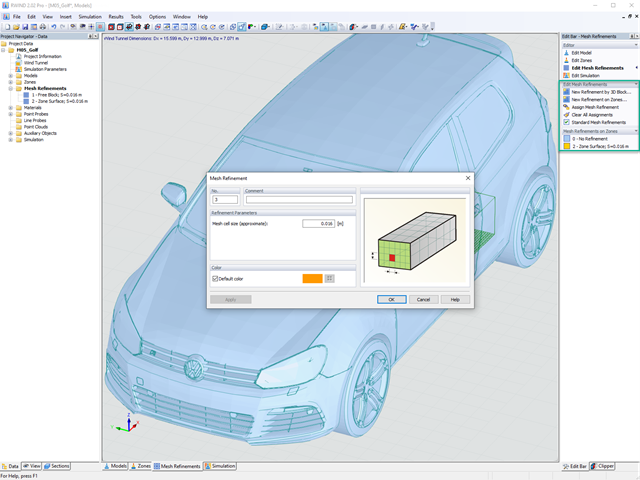
Do you already know the editor for mesh refinement control? It is a great help for your work! Why? It's easy – it gives you the following options:
- Graphic visualization of the areas with mesh refinements
- Mesh refinement of zones
- Deactivating the standard 3D solid mesh refinement with transversion into the corresponding manual 3D mesh refinements.
These options help you to formulate a suitable rule for meshing the entire model, even for the models with unusual dimensions. Use the editor to efficiently define small model details on large buildings or detailed meshing areas in the coating area of the model. You will be amazed!
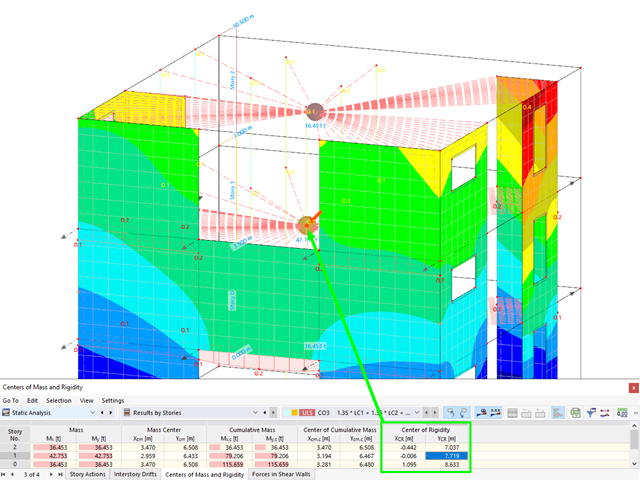
Have you activated the Building Model add-on? Very good! This allows you to display the center of rigidity in tabular and graphical form. Use it for your dynamic analysis, for example.
You can import table values from a prepared Excel table into RFEM 6 / RSTAB 9 with just a few clicks – either individually or all at once. For the import, you need to install a plug-in in Microsoft Excel according to this FAQ.
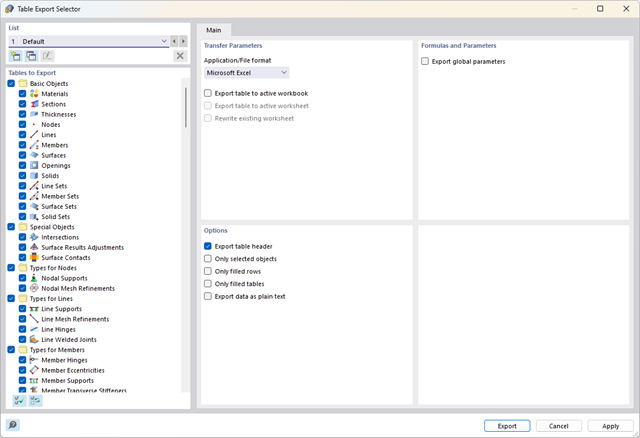
Did you know? You can export all RFEM/RSTAB tables with the results individually or all at once directly into an Excel table or as a CSV file. There are several options available to you:
- With table headers
- Selected objects only
- Filled rows only
- Only filled tables
- Export data as plain text
This way, the program allows you to control and clearly manage the exported data. You can export the stored formulas directly in the table or as a separate table, as in the case of the used parameters.
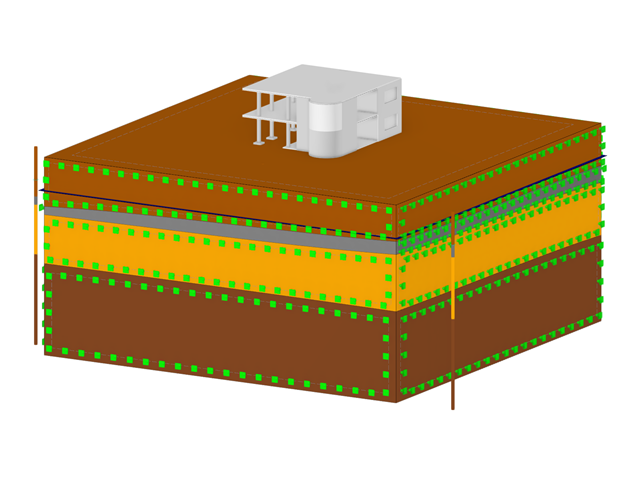
The soil solids that you want to analyze are summarized in soil massifs.
Use the soil samples as a basis for a definition of the respective soil massif. This way, the program allows for user-friendly generation of the massif, including the automatic determination of the layer interfaces from the sample data, as well as the groundwater level and the boundary surface supports.
Soil massifs provide you with the option to specify a target FE mesh size independently of the global setting for the rest of the structure. You can thus consider the various requirements of the building and soil in the entire model.
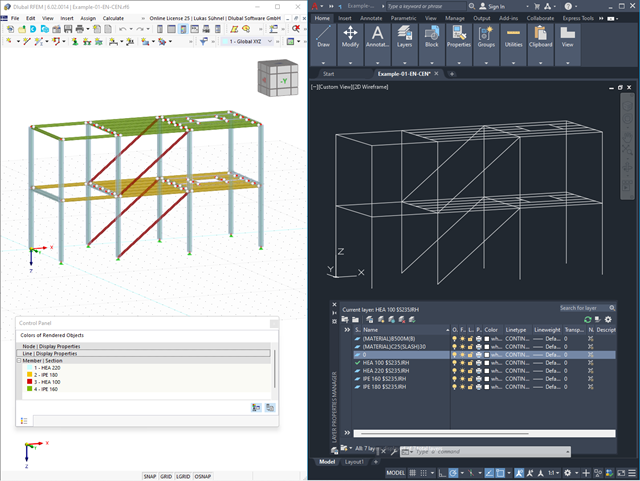
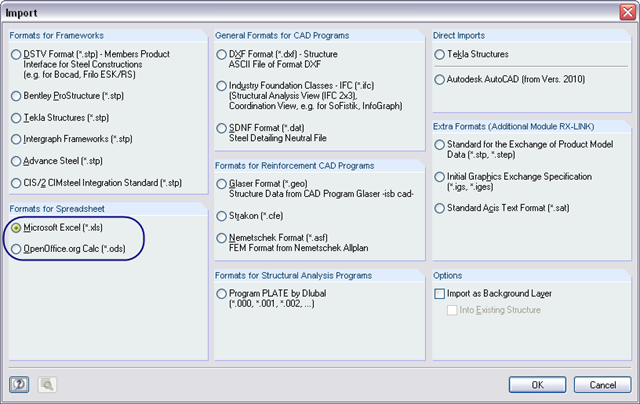
Use the interfaces for more efficient work. You can import your structures in the DXF format as lines from Autodesk AutoCAD into RFEM 6 / RSTAB 9.
Furthermore, you can export different objects (for example, cross-sections) from RFEM 6 / RSTAB 9 to separate layers in Autodesk AutoCAD.
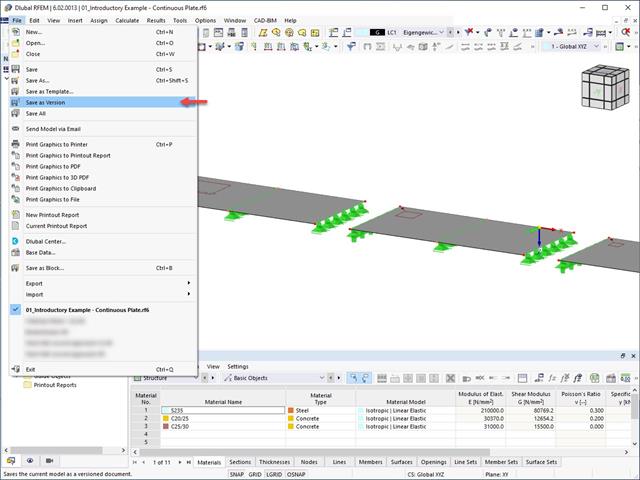
It is possible to save different model versions within a model by using the Save as Version function. In the Base Data of the model, the different model versions can be displayed in the History tab.
One thing is absolutely undisputed: WebService and API covers universal aspects in the construction industry. However, there is an issue. For the calculation and design, you need different features for each region, country, company, and civil engineer. Everyone has their own requirements. We have solved this problem. Since with WebService and API, you can easily create your very own calculation and design system. Always at your side: The performance and reliability of RFEM, RSTAB, and RSECTION.
The need for adapted and automated structural analysis and design is constantly increasing. WebService technology allows you to create special functionalities quickly and precisely. Our customers can develop such solutions independently or in cooperation with us. See for yourself and give it a try!
WebService and API provide you various scope of application. We have summarized some ideas as to how WebService and API can support your company:
- Creating additional applications for RFEM 6, RSTAB 9, and RSECTION 1
- Possibility to make the workflows more efficient (for example, model definition and input) and to integrate RFEM 6, RSTAB 9, and RSECTION 1 into your company applications
- Simulating and calculating several design options
- Running optimization algorithms for size, shape, and/or topology
- Accessing the calculation results
- Generation of printout reports in the PDF format
The level of quality of the work is automatically increased not only by the algorithmic model definitions, but also by:
- Extending / consolidating RFEM 6, RSTAB 9, and RSECTION 1 with your own controls
- Increased interoperability between the individual software used to complete a project
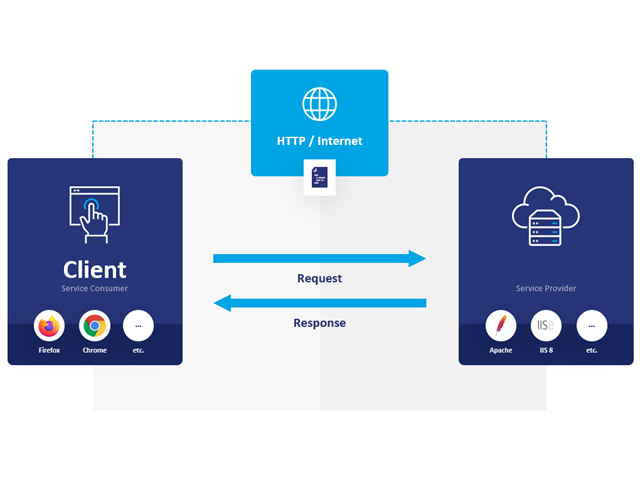
Communication is the key to success. This also applies to a client-server relation. WebService and API provides you with an XML based information exchange system for direct client-server communication. Programs, objects, messages, or documents can be integrated into these systems. For example, a web service protocol of the HTTP type runs for the client-server communication when you are looking for something in the Internet using a search engine.
Now back to Dlubal Software. In our case, the client is your programming environment (.NET, Python, JavaScript) and the service provider is RFEM 6. Client-server communication allows you to send requests to and receive feedback from RFEM, RSTAB, or RSECTION.
What is the difference between WebService and an API?
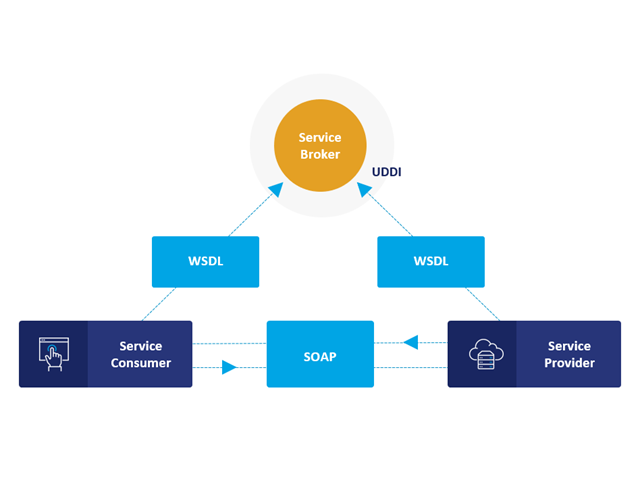
- WebService is a collection of open source protocols and standards used to exchange data between systems and applications. In contrast, an application programming interface (API), is a software interface through which two applications can interact without a user being involved.
- Thus, all web services are APIs, but not all APIs are web services.
What are the advantages of the WebService technology?
You can communicate more quickly within and between organizations.A service can be independent of other services.Webservice allows you to use your application to make your message or feature available to the rest of the world.Webservice helps you to exchange data between different applications and platforms Several applications can communicate, exchange data, and share services with each other. SOAP ensures that programs created on different platforms and based on different programming languages can exchange data securely.
Communication between the web service client and server is optionally encrypted via the https protocol. To do this, you can install an SSL certificate with the corresponding private key in the settings.
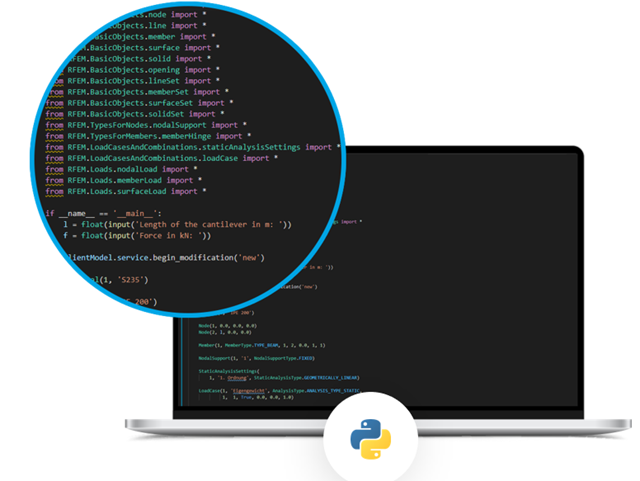
In theory, a web service can be created with any programming language. However, we, the Dlubal team, have decided on another way. We have created high-level function libraries for our users. With these high-level function libraries, you can create powerful scripts by simple programming. These libraries include:
- RFEM-Python High-Level Functions
- RSTAB-Python High-Level Functions
- RSECTION-Python High-Level Functions
- C# High-Level Functions
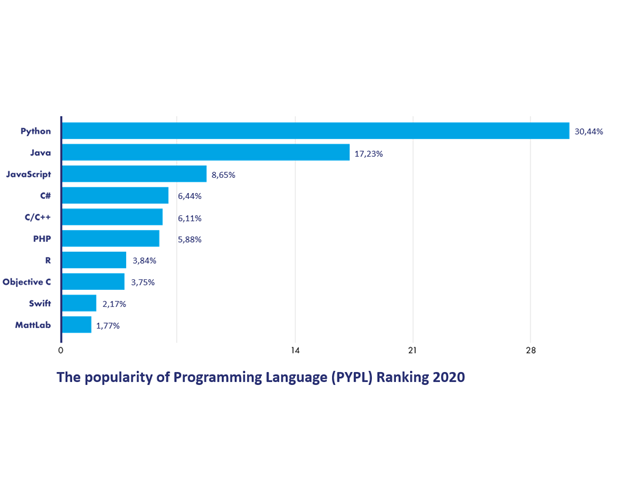
Why did we choose these programming languages? We decided on these programming languages for a specific reason, of course. Python, in particular, has the following features that we consider especially suitable:
- Simple and easy to learn
- Still very powerful
- Many extensions and libraries available
- Many resources available on the Internet
.jpg?mw=640&hash=26a7c7d3eca4bc6f129e08b373eac4f2314109ba)
Take your structural design one step further. RFEM 6 and RSTAB 9 support now a new file format for structural design, Structural Analysis Format (SAF). For this, both programs allow for the import as well as the export. SAF is a file format based on MS Excel, intended to facilitate the exchange of structural analysis models between different software applications.